

At a recent seminar, I was asked about data analytics for the Idea Catalog. Clearly, the databases contain a huge amount of information on individual technologies that is useful for seeing what others have already done. However, the aggregated data has the potential to provide insight for technological forecasting. It could help identify trends in specific technologies for instance. I thought I would do some small scale analysis for interest as a trial run for this year's student project.
The first thing I looked at was technological maturity. Technology Readiness Level (TRL) is the standard method of assessment and it is well known that many technologies do not make it through to the end. I was interested to know whether we had any data that could provide insight. An analysis of 2,000 robots is shown below. Most are at TRL 9 (in their own industry) with a healthy number in development. This is the current situation and a similar graph I did roughly one year ago shows approximately the same distribution. I plan to do some more detailed analysis, at a later date, to see how the picture has changed over time for individual types of technology; for instance are some types "easier" to get to TRL 9 than others?

The second analysis was to look at the types of robots included in the robotics database. I was interested to know whether a certain type of technology was more common. There are twice as many land platforms as aerial platforms for instance. But there is a good spread of other technology types included. This analysis is more about demonstrating that there is a fairly wide coverage in the database rather than suggesting there are more land platforms out there than, say, industrial robots. We have a backlog list of nearly 500 entries that we are still to add for instance with more every day, but we do not have the resource to get it all done at once. The picture may look a little different in 6 months time but it still feels as though the majority of investment is going into those top 3 - mobile land platforms, drones and sensors.

Many people are interested in where the vendors/manufacturers are located and whether these are clustered in specific cities or areas. So, does innovation feed innovation? The map below shows the distribution in the United States. The blue markers are the commercial vendors/manufacturers, the green markers are Universities with robotic entries and the Red markers are Government establishments with robotic entries. The map covers all industries and all TRLs and there are some definite identifiable clustering at some locations.
There is significant clustering around Universities (particularly Stanford, Harvard, MIT and CMU). There is also clustering in large cities as you'd expect (LA, San Diego, Denver, Atlanta, Chicago and the DC-Baltimore-NY corridor in particular). And, of course, in Silicon Valley. Government establishments with robotics do not seem to have much clustering nearby except maybe for Hanford (Seattle).

Clearly, there is potentially a lot of insight that can be gained from looking at the underlying data in the databases. The results will be skewed by the fact that we do not have every single product in the world included! Over time, as the content increases, the data will improve but there is, I think, still some interesting information that can be gathered whether for innovation strategy, product development or competitor analysis. We hope to have an Operational Research (OR) student from LSE or Loughborough who will be carrying out data analytics for their summer project and can develop these thoughts into something better.
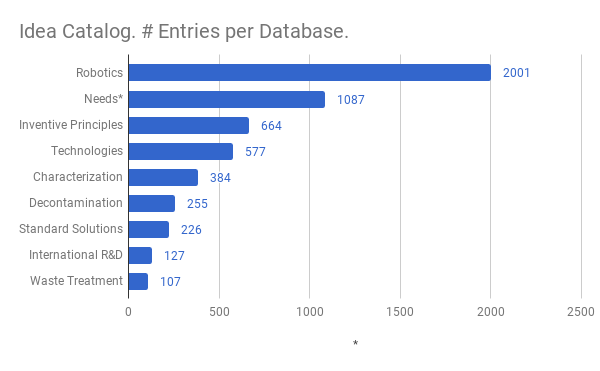
This analysis was just for the robotics database. This database has the largest number of entries, but there are other databases as well bringing the overall number of entries to over 5,000. So potentially some other interesting information available.
f you want to have a look at the Idea Catalog please go to the website and register. This is totally free and will allow you to view the summary page of the last 100 entries in each database. You will need to subscribe for a small fee in order to see all the information and be able to search and filter. Pricing is shown on the home page and is used to fund the continued update of the databases. We aim to keep things bang up-to-date and to cover a wide range of industries and TRLs so that there can be better sharing of information and knowledge management. This should lead to better efficiency and effectiveness for every organization that subscribes.
https://www.ideacatalog.net/
We are also currently developing our new AI chatbot we call "Genie". The idea behind this is to help users navigate through the system by asking questions and getting answers back. It's like Alexa or Google but for our technology databases. It is designed to learn as it is used and subscribers can find it by clicking on the Genie icon. Text or voice can be used. Currently we are working on pipeline characterization to help users identify potential crawlers. This is ongoing development and improvements will be made on a regular basis but please let me know if there is anything you would like to see developed.